






Normal distribution is one of the most important concepts in statistics and data science. It helps data scientists understand how values are spread around an average. Many measurements, such as height, test scores, and measurement errors, can follow a pattern that is close to a normal distribution. Learning this concept gives beginners a strong foundation for statistical analysis and machine learning. If you want to build your data science sBlockedword/sentences step by step, you can join Data Science Courses in Bangalore at FITA Academy to learn more about statistics, data analysis, and machine learning.
What is Normal Distribution
A normal distribution is a type of probability distribution in which the majority of values cluster around the mean, with fewer values found at the extremes. When the data is plotted on a graph, it usually creates a smooth, bell-shaped curve. This is why normal distribution is also called the bell curve.
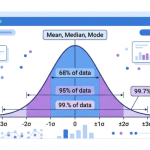
The center of the curve represents the mean, which is the average value of the dataset. The curve is symmetrical around this center, meaning the values are distributed in a balanced way on both sides. In a perfectly normal distribution, the mean, median, and mode have the same value.
Two important concepts describe a normal distribution. The first is the mean, which tells us where the center of the distribution is located. The second is the standard deviation, which tells us how widely the values are spread around the mean. A small standard deviation means that most values are close to the average. A larger standard deviation means the values are more spread out.
Understanding the 68 95 99.7 Rule
The 68 95 99.7 rule is a useful way to understand how values are distributed around the mean. In a normal distribution, about 68 percent of observations fall within one standard deviation of the mean. About 95 percent fall within two standard deviations, while about 99.7 percent fall within three standard deviations.
For example, imagine that the average score in a test is 70 and the standard deviation is 10. Around 68 percent of students would be expected to score between 60 and 80 if the scores followed a normal distribution. This simple idea helps data scientists estimate how common or unusual a particular observation might be.
Why Normal Distribution Matters in Data Science
The normal distribution is significant in the realm of statistical analysis. It provides a useful framework for understanding data patterns, identifying unusual observations, and making statistical assumptions. Many statistical methods work best when certain variables approximately follow a normal distribution.
It is also useful when analyzing samples. Statistical ideas like confidence intervals and hypothesis testing frequently depend on assumptions tied to normal distribution. Understanding the distribution helps data scientists decide which statistical techniques may be appropriate for a particular dataset.
Normal distribution also appears in machine learning. Some algorithms and data preprocessing techniques can benefit when numerical features have distributions that are reasonably balanced. Standardization, for example, often uses the mean and standard deviation to transform numerical variables into a common scale. If you want to strengthen your understanding of statistics and machine learning, take a Data Science Course in Hyderabad to explore these concepts through practical learning.
Normal Distribution and Real World Data
Not all datasets conform to a normal distribution, which is a crucial concept for those who are just starting out. Some datasets may be skewed toward one side, contain multiple peaks, or have extreme values. Income, property prices, and website traffic are examples of data that may not follow a normal pattern.
Data scientists therefore examine the shape of a dataset before assuming that it is normally distributed. Visual tools such as histograms and probability plots can help identify whether the data approximately follows a bell-shaped pattern. Statistical tests can also provide additional information about normality.
Understanding when normal distribution applies is more valuable than simply memorizing its rules. It allows data scientists to choose appropriate methods and avoid making incorrect assumptions about their data.
Normal distribution provides a simple and powerful way to understand how numerical data can be organized around an average. Its relationship with the mean and standard deviation makes it useful for interpreting variation, identifying unusual values, and supporting statistical analysis. While real-world data does not always follow a perfect bell curve, the concept remains an important foundation for learning statistics and data science. If you are ready to develop practical sBlockedword/sentences in data analysis, statistics, and machine learning, explore a Data Science Course in Ahmedabad to enhance your comprehension and implement these ideas on actual datasets.
Also check: Types of Data Used in Data Science